


Dollar Cost Average Through Down Markets
Preparing for Market Downturns
Market downturns can feel scary. Seeing account balances drop can create the urge to stop investing or wait until markets “feel safer.”
But historically, some of the most successful long-term investors follow a different approach: they keep investing consistently—especially during downturns.
We call this dollar cost averaging (DCA).
Dollar-cost averaging simply means investing the same amount of money at regular intervals—no matter what the market is doing.
Why Market Downturns Can Actually Help
When markets decline, prices for stocks and funds become cheaper.
If you continue investing during those periods, your fixed investment amount buys more shares.
Later, when markets recover, those additional shares can significantly boost your portfolio’s value.
Examples
Here’s a simple example using two different graphs:
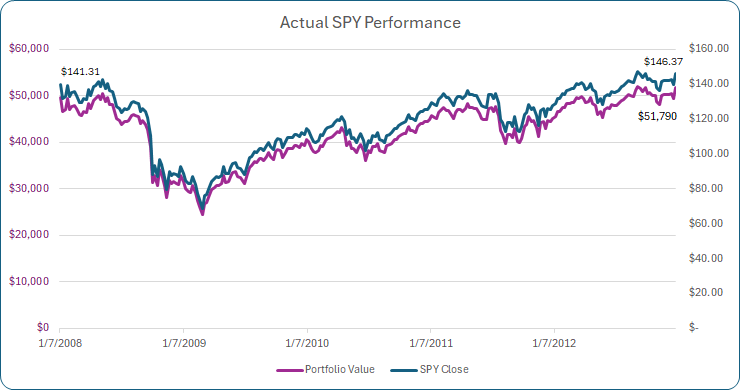
First, for the time period of January 2008 to December 2012 a $50,000 investment in the S&P500 ETF (SPY) would have grown 3.6% to $51,790. As you can see in the graph below, there were a few drops in price during this 5-year period. In fact, the peak price of $142.66 in May of 2008 was not seen again until August 2012.
However, if you would have added $100 per week to your $50,000 investment in the S&P500 (SPY etf), during this time period you have ended with $84,700.
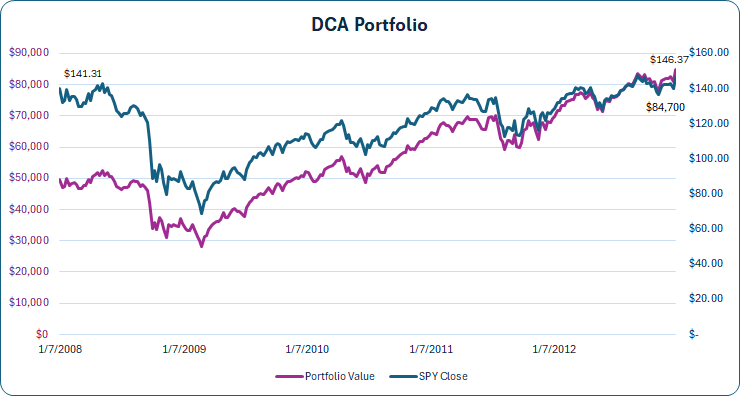
This is the power of dollar cost averaging.
Over time, this strategy helps you lower your average cost per share because you naturally buy more when prices are down and less when prices are high.
This hypothetical investor in scenario 2 added $26,100 through DCA over 5 years to their $50,000 portfolio. The ending 5-year balance is $84,700.
Why this matters long-term:
✔ Removes the pressure of trying to “time the market”
✔ Turns volatility into opportunity
✔ Builds disciplined investing habits
✔ Can improve long-term portfolio growth
One of the most common mistakes investors make is stopping their investments during market declines.
This often happens because:
- Headlines feel negative
- Account balances temporarily fall
- Investors wait for markets to “stabilize”
Unfortunately, this often means missing the early stages of a market recovery—when some of the strongest returns occur. When you DCA, you will have more shares when the recovery happens. Investors who stay consistent during downturns are often the ones who benefit the most when markets rebound.
How Our Clients DCA
401k's are a great example of dollar cost averaging for most investors since it comes right out of your paycheck.
Another way is setting up an automatic recurring transfer from your checking account to your investment account just like all your other monthly bills. Automation is the key to consistency in finance.
Summary
If you are concerned about the stock market, consistency can be your friend. Dollar cost averaging into more shares as the markets drop may help you enjoy the ride up that much more.
As always - Keep Saving!
-Savings Coach
Charts are using actual historical returns of SPY etf. Investment scenarios are hypothetical and for illustrative purposes only. Below table lists week-ending price of SPY ETF during period shown.
Date | Close |
12/31/2007 | $ 141.31 |
1/7/2008 | $ 140.15 |
1/14/2008 | $ 132.06 |
1/22/2008 | $ 133.04 |
1/28/2008 | $ 139.58 |
2/4/2008 | $ 133.07 |
2/11/2008 | $ 135.14 |
2/19/2008 | $ 135.62 |
2/25/2008 | $ 133.82 |
3/3/2008 | $ 129.71 |
3/10/2008 | $ 129.61 |
3/17/2008 | $ 132.08 |
3/24/2008 | $ 131.51 |
3/31/2008 | $ 136.89 |
4/7/2008 | $ 133.38 |
4/14/2008 | $ 138.48 |
4/21/2008 | $ 139.60 |
4/28/2008 | $ 141.51 |
5/5/2008 | $ 138.90 |
5/12/2008 | $ 142.66 |
5/19/2008 | $ 137.64 |
5/27/2008 | $ 140.35 |
6/2/2008 | $ 136.29 |
6/9/2008 | $ 136.15 |
6/16/2008 | $ 131.58 |
6/23/2008 | $ 127.53 |
6/30/2008 | $ 126.31 |
7/7/2008 | $ 123.84 |
7/14/2008 | $ 125.98 |
7/21/2008 | $ 125.48 |
7/28/2008 | $ 126.16 |
8/4/2008 | $ 129.37 |
8/11/2008 | $ 130.17 |
8/18/2008 | $ 129.65 |
8/25/2008 | $ 128.79 |
9/2/2008 | $ 124.42 |
9/8/2008 | $ 126.09 |
9/15/2008 | $ 124.12 |
9/22/2008 | $ 120.85 |
9/29/2008 | $ 110.34 |
10/6/2008 | $ 88.50 |
10/13/2008 | $ 93.21 |
10/20/2008 | $ 87.04 |
10/27/2008 | $ 96.83 |
11/3/2008 | $ 93.86 |
11/10/2008 | $ 86.62 |
11/17/2008 | $ 79.52 |
11/24/2008 | $ 90.09 |
12/1/2008 | $ 87.93 |
12/8/2008 | $ 88.99 |
12/15/2008 | $ 88.19 |
12/22/2008 | $ 87.16 |
12/29/2008 | $ 92.96 |
1/5/2009 | $ 89.09 |
1/12/2009 | $ 85.06 |
1/20/2009 | $ 83.11 |
1/26/2009 | $ 82.83 |
2/2/2009 | $ 86.98 |
2/9/2009 | $ 82.76 |
2/17/2009 | $ 77.42 |
2/23/2009 | $ 73.93 |
3/2/2009 | $ 68.92 |
3/9/2009 | $ 76.09 |
3/16/2009 | $ 76.71 |
3/23/2009 | $ 81.61 |
3/30/2009 | $ 84.26 |
4/6/2009 | $ 85.81 |
4/13/2009 | $ 87.08 |
4/20/2009 | $ 86.66 |
4/27/2009 | $ 87.89 |
5/4/2009 | $ 92.98 |
5/11/2009 | $ 88.71 |
5/18/2009 | $ 89.02 |
5/26/2009 | $ 92.53 |
6/1/2009 | $ 94.55 |
6/8/2009 | $ 95.08 |
6/15/2009 | $ 92.04 |
6/22/2009 | $ 91.84 |
6/29/2009 | $ 89.81 |
7/6/2009 | $ 87.96 |
7/13/2009 | $ 94.13 |
7/20/2009 | $ 98.06 |
7/27/2009 | $ 98.81 |
8/3/2009 | $ 101.20 |
8/10/2009 | $ 100.79 |
8/17/2009 | $ 102.97 |
8/24/2009 | $ 103.38 |
8/31/2009 | $ 102.06 |
9/8/2009 | $ 104.77 |
9/14/2009 | $ 106.72 |
9/21/2009 | $ 104.45 |
9/28/2009 | $ 102.49 |
10/5/2009 | $ 107.26 |
10/12/2009 | $ 108.89 |
10/19/2009 | $ 108.08 |
10/26/2009 | $ 103.56 |
11/2/2009 | $ 107.13 |
11/9/2009 | $ 109.62 |
11/16/2009 | $ 109.43 |
11/23/2009 | $ 109.57 |
11/30/2009 | $ 111.01 |
12/7/2009 | $ 111.11 |
12/14/2009 | $ 110.21 |
12/21/2009 | $ 112.48 |
12/28/2009 | $ 111.44 |
1/4/2010 | $ 114.57 |
1/11/2010 | $ 113.64 |
1/19/2010 | $ 109.21 |
1/25/2010 | $ 107.39 |
2/1/2010 | $ 106.66 |
2/8/2010 | $ 108.04 |
2/16/2010 | $ 111.14 |
2/22/2010 | $ 110.74 |
3/1/2010 | $ 114.25 |
3/8/2010 | $ 115.46 |
3/15/2010 | $ 115.97 |
3/22/2010 | $ 116.58 |
3/29/2010 | $ 117.80 |
4/5/2010 | $ 119.55 |
4/12/2010 | $ 119.36 |
4/19/2010 | $ 121.81 |
4/26/2010 | $ 118.81 |
5/3/2010 | $ 111.26 |
5/10/2010 | $ 113.89 |
5/17/2010 | $ 109.12 |
5/24/2010 | $ 109.37 |
6/1/2010 | $ 106.82 |
6/7/2010 | $ 109.68 |
6/14/2010 | $ 111.73 |
6/21/2010 | $ 107.87 |
6/28/2010 | $ 102.20 |
7/6/2010 | $ 107.96 |
7/12/2010 | $ 106.66 |
7/19/2010 | $ 110.41 |
7/26/2010 | $ 110.27 |
8/2/2010 | $ 112.39 |
8/9/2010 | $ 108.31 |
8/16/2010 | $ 107.53 |
8/23/2010 | $ 106.86 |
8/30/2010 | $ 110.89 |
9/7/2010 | $ 111.48 |
9/13/2010 | $ 112.49 |
9/20/2010 | $ 114.82 |
9/27/2010 | $ 114.61 |
10/4/2010 | $ 116.54 |
10/11/2010 | $ 117.70 |
10/18/2010 | $ 118.35 |
10/25/2010 | $ 118.49 |
11/1/2010 | $ 122.73 |
11/8/2010 | $ 120.20 |
11/15/2010 | $ 120.29 |
11/22/2010 | $ 119.29 |
11/29/2010 | $ 122.89 |
12/6/2010 | $ 124.48 |
12/13/2010 | $ 124.30 |
12/20/2010 | $ 125.60 |
12/27/2010 | $ 125.75 |
1/3/2011 | $ 127.14 |
1/10/2011 | $ 129.30 |
1/18/2011 | $ 128.37 |
1/24/2011 | $ 127.72 |
1/31/2011 | $ 131.15 |
2/7/2011 | $ 133.11 |
2/14/2011 | $ 134.53 |
2/22/2011 | $ 132.33 |
2/28/2011 | $ 132.47 |
3/7/2011 | $ 130.84 |
3/14/2011 | $ 127.76 |
3/21/2011 | $ 131.30 |
3/28/2011 | $ 133.15 |
4/4/2011 | $ 132.86 |
4/11/2011 | $ 132.04 |
4/18/2011 | $ 133.78 |
4/25/2011 | $ 136.43 |
5/2/2011 | $ 134.20 |
5/9/2011 | $ 134.04 |
5/16/2011 | $ 133.61 |
5/23/2011 | $ 133.51 |
5/31/2011 | $ 130.42 |
6/6/2011 | $ 127.60 |
6/13/2011 | $ 127.05 |
6/20/2011 | $ 126.81 |
6/27/2011 | $ 133.92 |
7/5/2011 | $ 134.40 |
7/11/2011 | $ 131.69 |
7/18/2011 | $ 134.58 |
7/25/2011 | $ 129.33 |
8/1/2011 | $ 120.08 |
8/8/2011 | $ 118.12 |
8/15/2011 | $ 112.64 |
8/22/2011 | $ 117.97 |
8/29/2011 | $ 117.85 |
9/6/2011 | $ 115.92 |
9/12/2011 | $ 121.52 |
9/19/2011 | $ 113.54 |
9/26/2011 | $ 113.15 |
10/3/2011 | $ 115.71 |
10/10/2011 | $ 122.57 |
10/17/2011 | $ 123.97 |
10/24/2011 | $ 128.60 |
10/31/2011 | $ 125.48 |
11/7/2011 | $ 126.66 |
11/14/2011 | $ 121.98 |
11/21/2011 | $ 116.34 |
11/28/2011 | $ 124.86 |
12/5/2011 | $ 126.05 |
12/12/2011 | $ 121.59 |
12/19/2011 | $ 126.39 |
12/27/2011 | $ 125.50 |
1/3/2012 | $ 127.71 |
1/9/2012 | $ 128.84 |
1/17/2012 | $ 131.95 |
1/23/2012 | $ 131.82 |
1/30/2012 | $ 134.54 |
2/6/2012 | $ 134.36 |
2/13/2012 | $ 136.41 |
2/21/2012 | $ 136.93 |
2/27/2012 | $ 137.31 |
3/5/2012 | $ 137.57 |
3/12/2012 | $ 140.30 |
3/19/2012 | $ 139.65 |
3/26/2012 | $ 140.81 |
4/2/2012 | $ 139.79 |
4/9/2012 | $ 137.14 |
4/16/2012 | $ 137.95 |
4/23/2012 | $ 140.39 |
4/30/2012 | $ 137.00 |
5/7/2012 | $ 135.61 |
5/14/2012 | $ 129.74 |
5/21/2012 | $ 132.10 |
5/29/2012 | $ 128.16 |
6/4/2012 | $ 133.10 |
6/11/2012 | $ 134.14 |
6/18/2012 | $ 133.46 |
6/25/2012 | $ 136.11 |
7/2/2012 | $ 135.49 |
7/9/2012 | $ 135.75 |
7/16/2012 | $ 136.47 |
7/23/2012 | $ 138.68 |
7/30/2012 | $ 139.35 |
8/6/2012 | $ 140.84 |
8/13/2012 | $ 142.18 |
8/20/2012 | $ 141.51 |
8/27/2012 | $ 141.16 |
9/4/2012 | $ 144.33 |
9/10/2012 | $ 147.24 |
9/17/2012 | $ 145.87 |
9/24/2012 | $ 143.97 |
10/1/2012 | $ 146.14 |
10/8/2012 | $ 142.89 |
10/15/2012 | $ 143.39 |
10/22/2012 | $ 141.35 |
10/31/2012 | $ 141.56 |
11/5/2012 | $ 138.16 |
11/12/2012 | $ 136.37 |
11/19/2012 | $ 141.35 |
11/26/2012 | $ 142.16 |
12/3/2012 | $ 142.42 |
12/10/2012 | $ 142.11 |
12/17/2012 | $ 142.79 |
12/24/2012 | $ 140.03 |
12/31/2012 | $ 146.37 |